2. Workflows
Typical workflows that explore the combinations of analysis possible in R2
2.1. Workflow: Generate a direct link to a public dataset in R2
If you would like to include a direct hyperlink to a public dataset in R2, then you can follow the procedure described here.
Make sure that you are NOT logged in with your own account. So log off in case that you are logged in. In this way, you are sure that the intended resource is ‘public’.
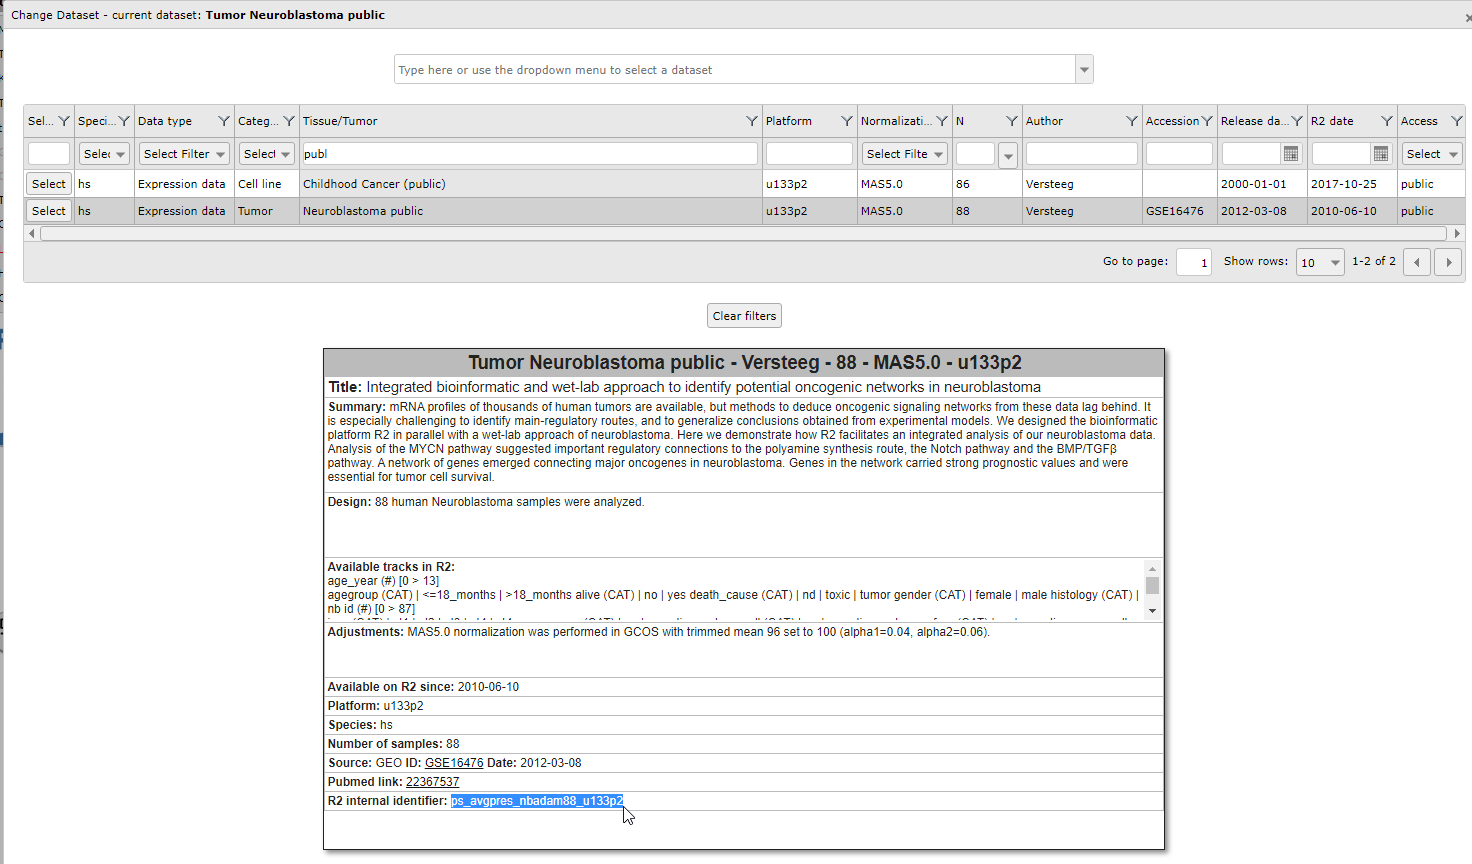
At the main page, use the ‘Select Dataset’ button and search for the data set that you would like to create a link to.
 Figure 1: Creating a direct link to an R2 dataset
Click anywhere on the dataset record, except the ‘select’ button. This will load the dataset information card. At the bottom of this card you will find the dataset identifier. Copy this identifier and add it to the following address (we have used ‘ps_avgpres_nbadam88_u133p2’ in the line below):
https://hgserver1.amc.nl/cgi-bin/r2/main.cgi?table=ps_avgpres_nbadam88_u133p2
The web address can be copied directly and be provided as a reference to the dataset.
2.2. Workflow: Marking samples in a YY or XY plot
Marking a single sample
With the ‘samples to mark’ option, you can make samples stand out. The easiest is marking a single sample using the R2 default setting. Make sure that you add a samplename (e.g. itcc0288) from the current dataset and press ‘redraw’. The indicated sample is now highlighted by an orange line.
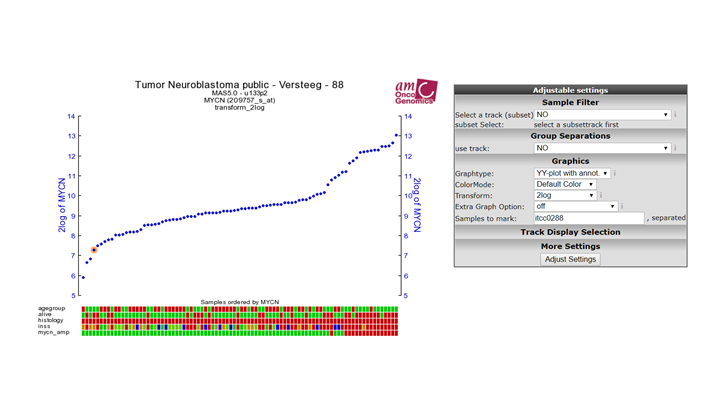 Figure 1: Mark a single sample
Figure 1: Mark a single sample
Types of markings
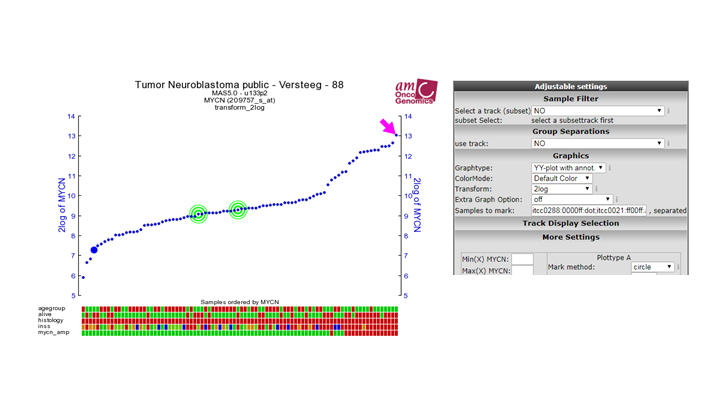
We can change the type of mark by changing the mark method from ‘dot’, to one of the other methods. ‘circle’ will draw an open circle around the sample; epicenter will draw a range of larger circles around the marked patient; and ‘arrow’ will place an arrow pointing to the sample.
 Figure 2: Mark options
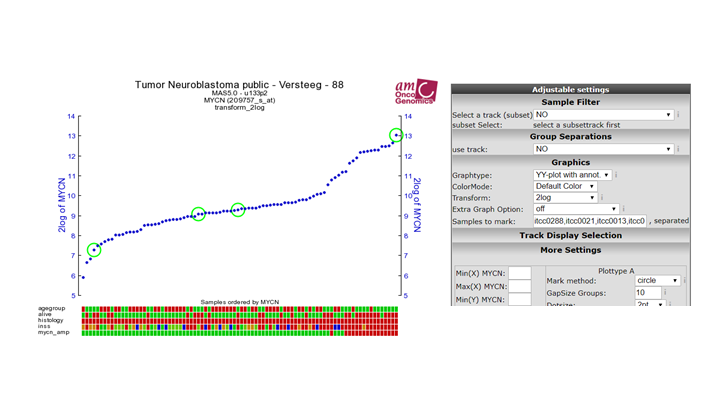
Coloring and marking multiple samples
Marking more than 1 sample is achieved by ’,’ separation (e.g. itcc0288,itcc0021,itcc0013,itcc0132). Thus far all have been of the same color. We can also change the color of the marker by adding ‘:’ followed by a hex color (e.g. itcc0288,itcc0021,itcc0013,itcc0132:00ff00).
 Figure 3: Mark and color multiple samples
Figure 3: Mark and color multiple samples
Defining sample groups
The previous example made all 4 samples green. We can also define groups and define different colors to every group. Groups are separated by ‘;’. To color our previous example with 2 groups, each having a different color, we define the following: itcc0288,itcc0021:ff00ff;itcc0013,itcc0132:00ff00
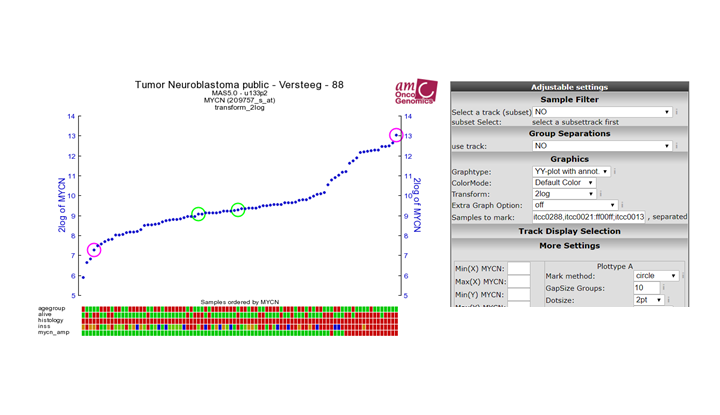 Figure 4: Mark with sample groups
Figure 4: Mark with sample groups
Advanced usage
As a default, the mark method will be defined from the dropdown box as we have used in step 2. However, you can also define the method within the ‘samples to mark’ box by adding another ‘:’ after the color representation. Defining this will overrule the default setting, and thus also enable the use of different markings within the same figure. So the skeleton for advanced usage is : ‘sample1,sample2:color1:method1;sample3,sample4:color2:method2’. For example: ‘”itcc0288:0000ff:dot;itcc0021:ff00ff:arrow;itcc0013,itcc0132:00ff00:epicenter”’ creates the markings as shown in the figure.
 Figure 5: Mark with advanced options
Figure 5: Mark with advanced options
![]() Did you know box
Did you know box
R2 knows a couple of mark options, that you can make use of in the advanced prescriptions:
- ‘dot’: places a thick border around the sample
- ‘circle’: Places a ring around the sample (diameter 9)
- ‘circle_2’: Places a ring around the sample (diameter 4)
- ‘circle_3’: Places a ring around the sample (diameter 1), effectively a thin border
- ‘epicenter’: Places a set of 3 rings descending in width around a sample
- ‘arrow’: Places a block arrow pointing to the sample
- ‘triangle’: Places a filled triangle under the sample
Note: The dotsize does not scale with ‘arrow’ and ‘triangle’ method.
2.3. Workflow: Drawing lines between samples in an XY plot
Drawing a line between 2 samples
To indicate a relation between different samples within a dataset it can sometimes be informative to add a line between samples. One can think of a pair for example, or perhaps a temporal relationship such as an on-off state or a time series. Within the XY plot of R2, we have a variable called ‘sample paths’, which can be used to add a line between samples. The easiest example, is to connect 2 samples within a plot. Using dataset ‘Mixed Neuroblastoma (MES-ADRN-Crest-Exp) - Versteeg - 52 - MAS5.0 - u133p2’, we can add a line between a pair of samples by putting ‘gsm2413241,gsm2413246’ in the sample paths input.
gsm2413241,gsm2413246
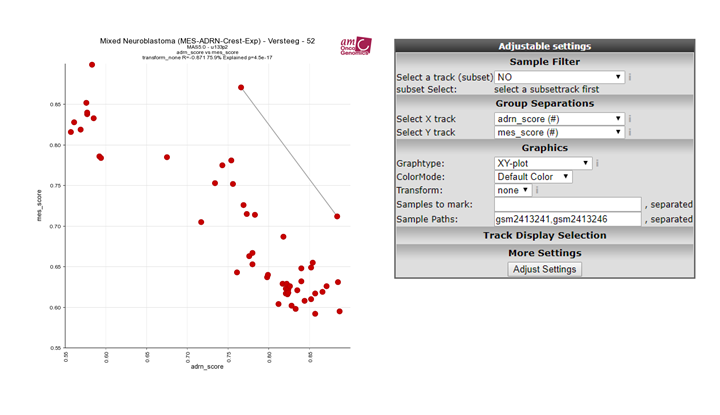 Figure 1: Connect 2 samples
Path properties
The appearance of the line can also be influenced by providing a color (hex number) and a linewidth. The recipe for these adaptations makes use of ‘:’ and works as follows. sample1,sample2:colorcode:width. Let’s give this a try by making the line red with a thickness of 3. Add ‘gsm2413241,gsm2413246:#ff0000:3’ to the path box.
gsm2413241,gsm2413246:#ff0000:3
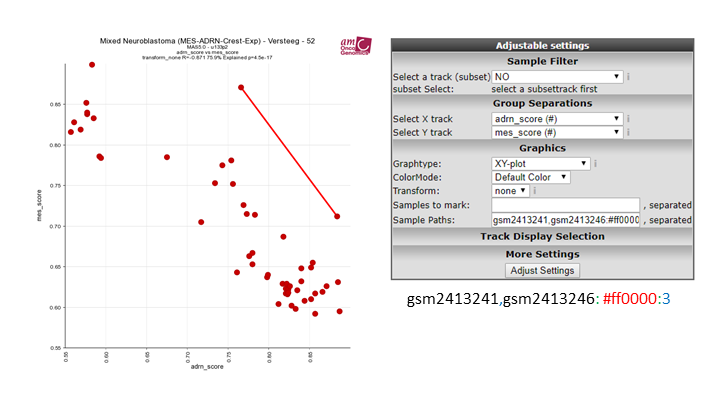 Figure 2: path properties
Drawing multiple paths
We can draw multiple paths by separating them with ‘;’. Let’s give this a try by drawing a line between 4 pairs of samples in the current dataset in light grey. Add ‘gsm2413241,gsm2413246:#eeeeee; gsm2413239,gsm2413243:#eeeeee; gsm2413242,gsm2413245:#eeeeee; gsm2413240,gsm2413244:#eeeeee’ in the sample path box.
gsm2413241,gsm2413246:#eeeeee; gsm2413239,gsm2413243:#eeeeee; gsm2413242,gsm2413245:#eeeeee; gsm2413240,gsm2413244:#eeeeee
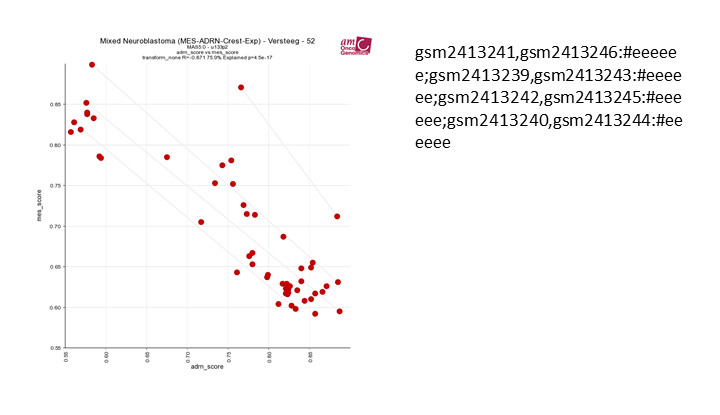 Figure 3: Connect 2 samples
Drawing multisample paths
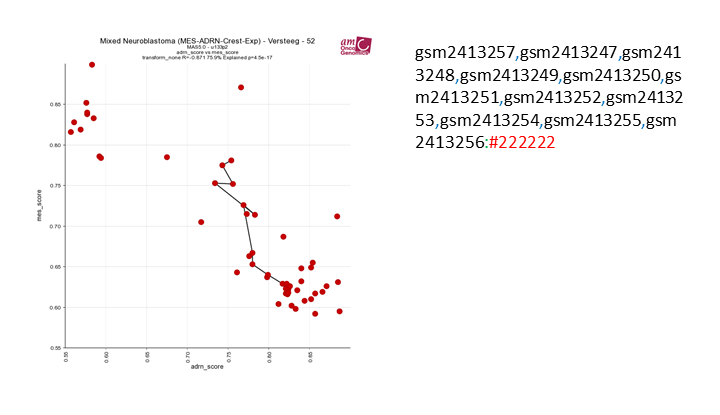
If the width and color of multiple samples can be the same, then you can also define longer paths by adding more samples in a row, by adding more samples, divided by a ‘,’. Lets give this a try by defining a time series within this dataset. Add ‘gsm2413257, gsm2413247, gsm2413248, gsm2413249, gsm2413250, gsm2413251, gsm2413252, gsm2413253, gsm2413254, gsm2413255, gsm2413256:#222222’ to the box.
gsm2413257, gsm2413247, gsm2413248, gsm2413249, gsm2413250, gsm2413251, gsm2413252, gsm2413253, gsm2413254, gsm2413255, gsm2413256:#222222
 Figure 4: Connect 2 samples
Drawing multisample paths
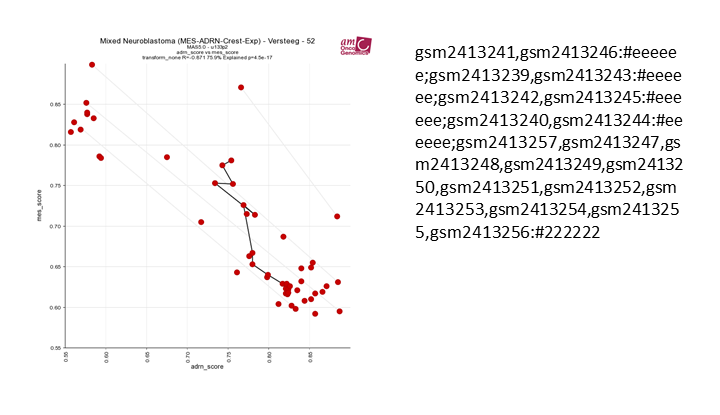
We can also combine the 2 previous ones into 1 picture by addding ‘gsm2413241,gsm2413246:#eeeeee; gsm2413239,gsm2413243:#eeeeee; gsm2413242,gsm2413245:#eeeeee; gsm2413240,gsm2413244:#eeeeee; gsm2413257,gsm2413247,gsm2413248,gsm2413249,gsm2413250, gsm2413251,gsm2413252,gsm2413253,gsm2413254,gsm2413255,gsm2413256:#222222’ in the sample path box.
gsm2413241,gsm2413246:#eeeeee; gsm2413239,gsm2413243:#eeeeee; gsm2413242,gsm2413245:#eeeeee; gsm2413240,gsm2413244:#eeeeee; gsm2413257, gsm2413247, gsm2413248, gsm2413249,gsm2413250, gsm2413251, gsm2413252, gsm2413253, gsm2413254, gsm2413255, gsm2413256:#222222
 Figure 5: Connect 2 samples
2.4. Workflow: Final Remarks
For description of many functions in R2, we have assembled a tutorial book, which can be found at r2-tutorials.